Analysis
This is a summary of the current state from my amateur’s view. The charts below provide the details but here is a summary!
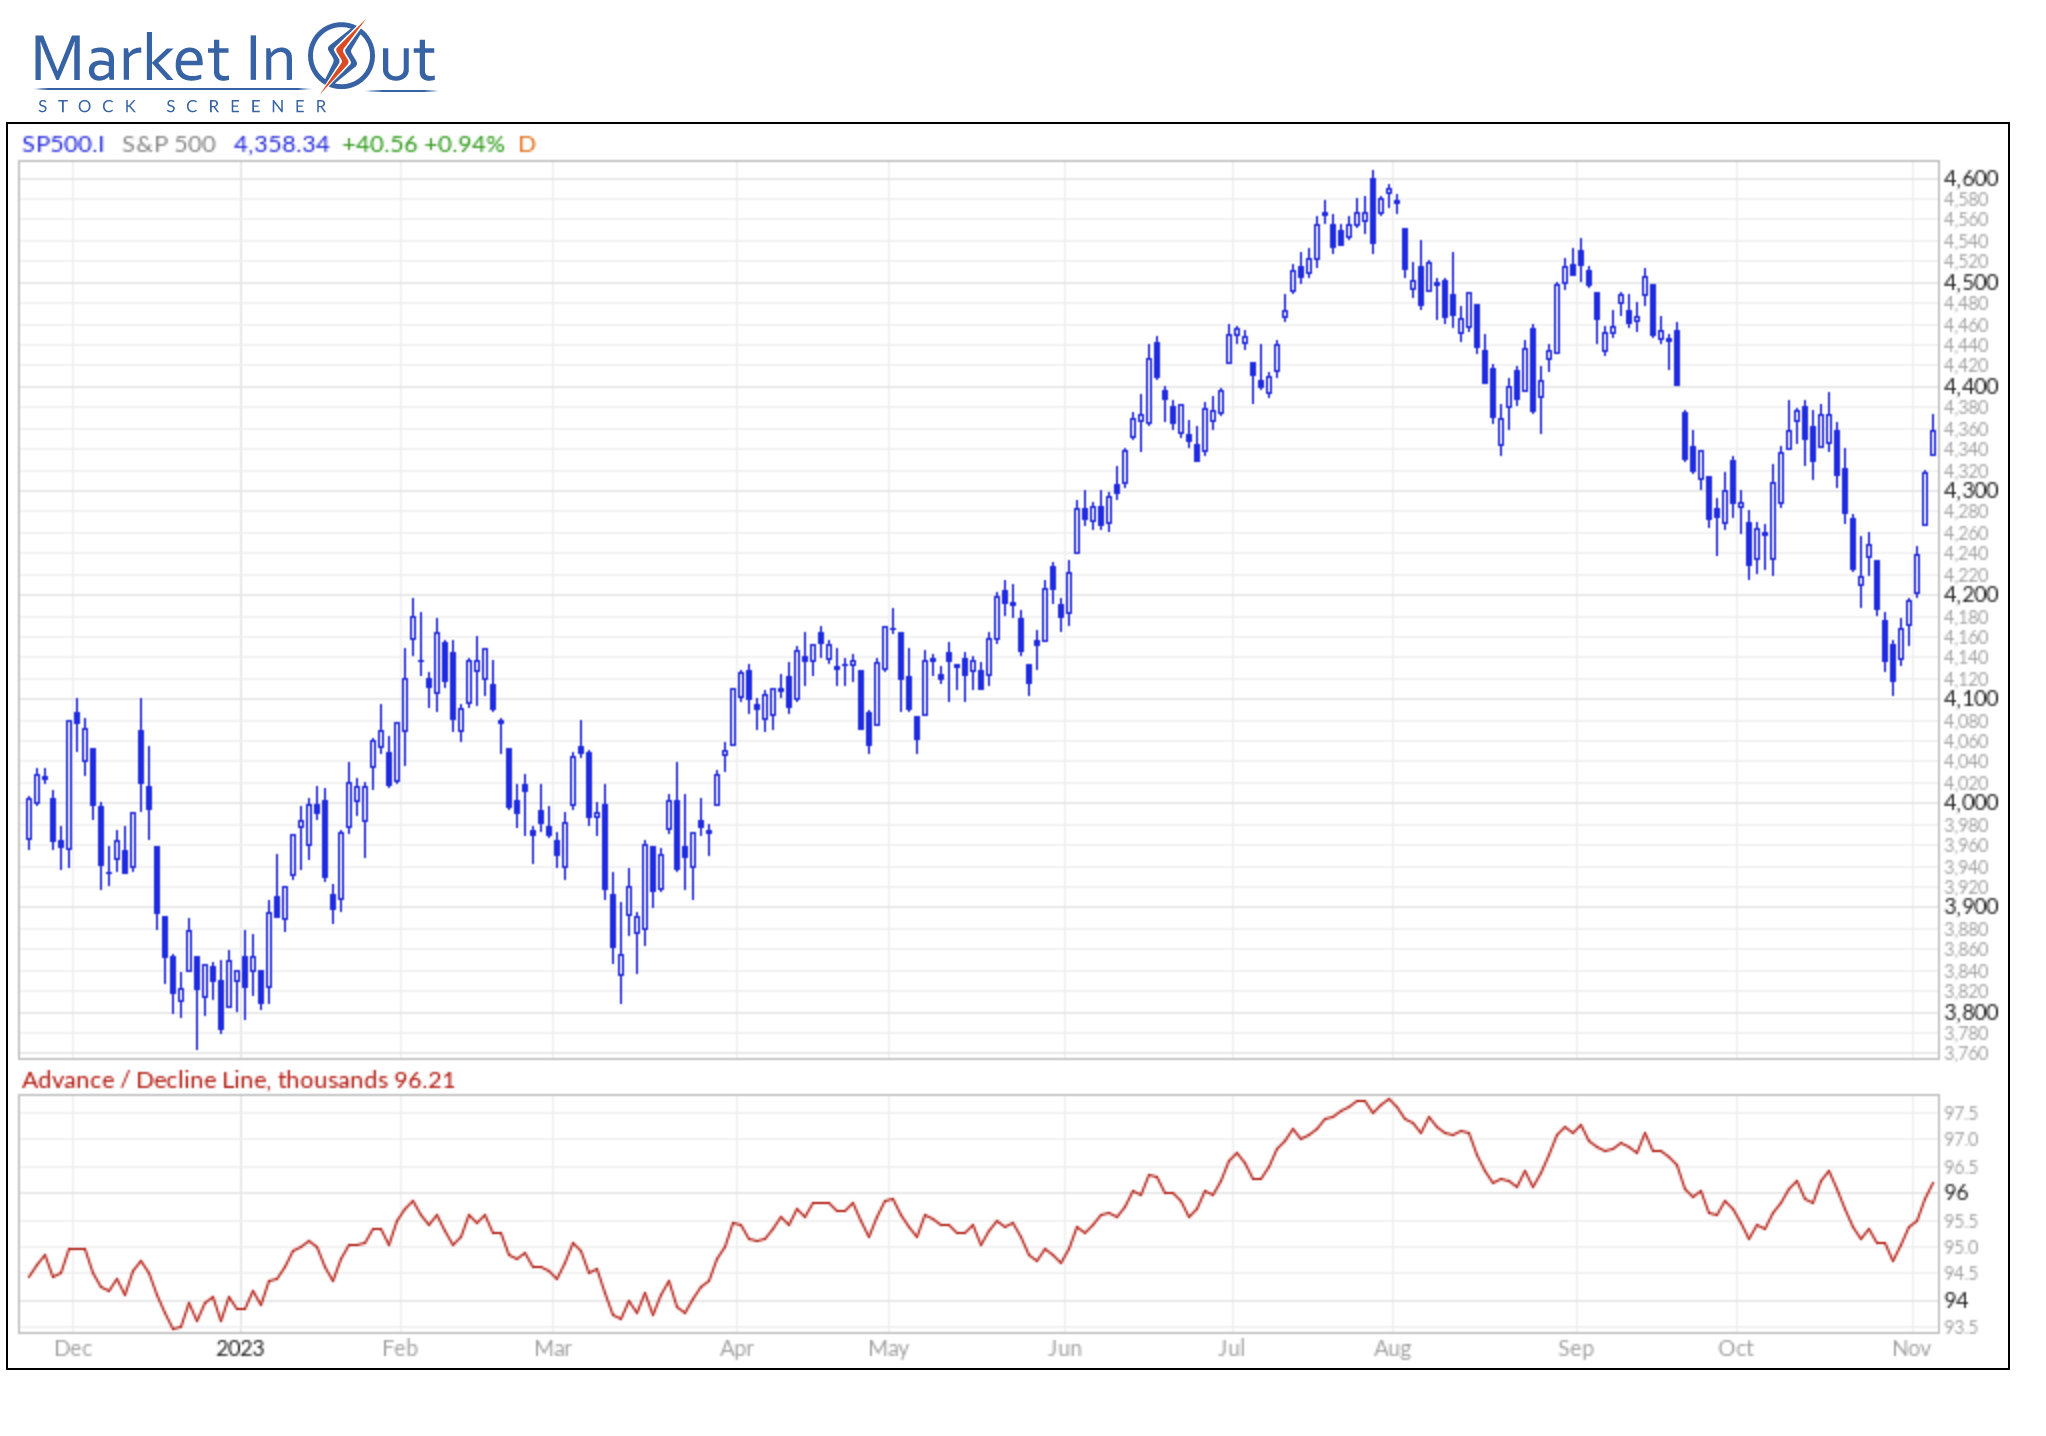
The stock market is in a hesitant state. “Everybody” have been bears for quite a while (at least since the start of the Ukraince war) but the stock market has been ticking upwards. The Shiller PE is almost at 30 which is very high historically although it has sunc back somewhat the last year. The SP500 Advance/Decline line has turned up again after deecreasing during the seeconf half of October.
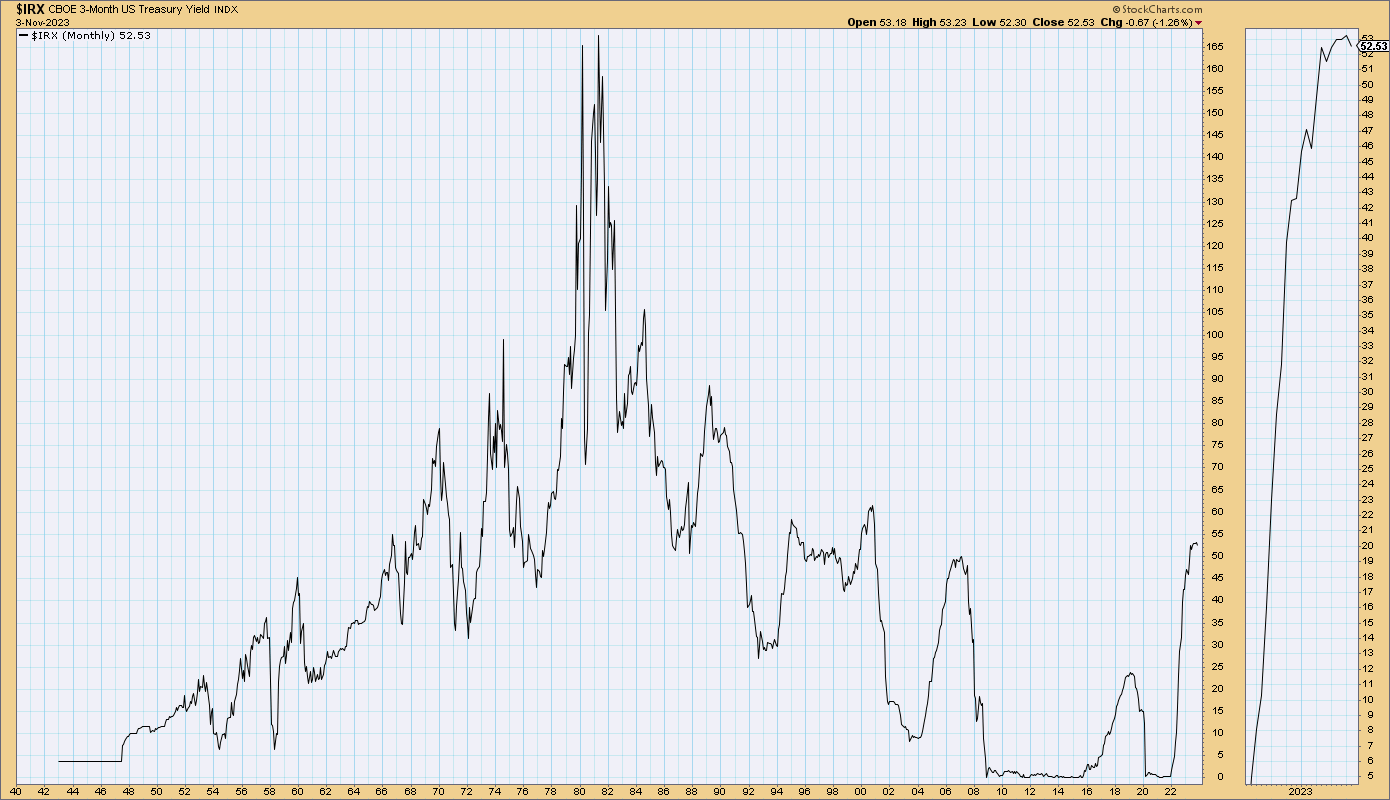
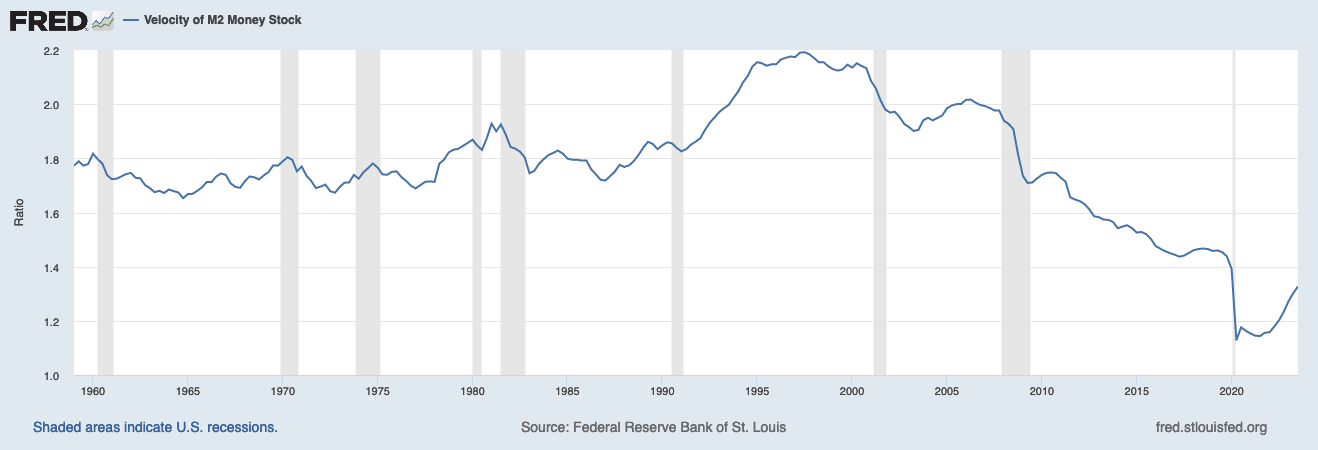
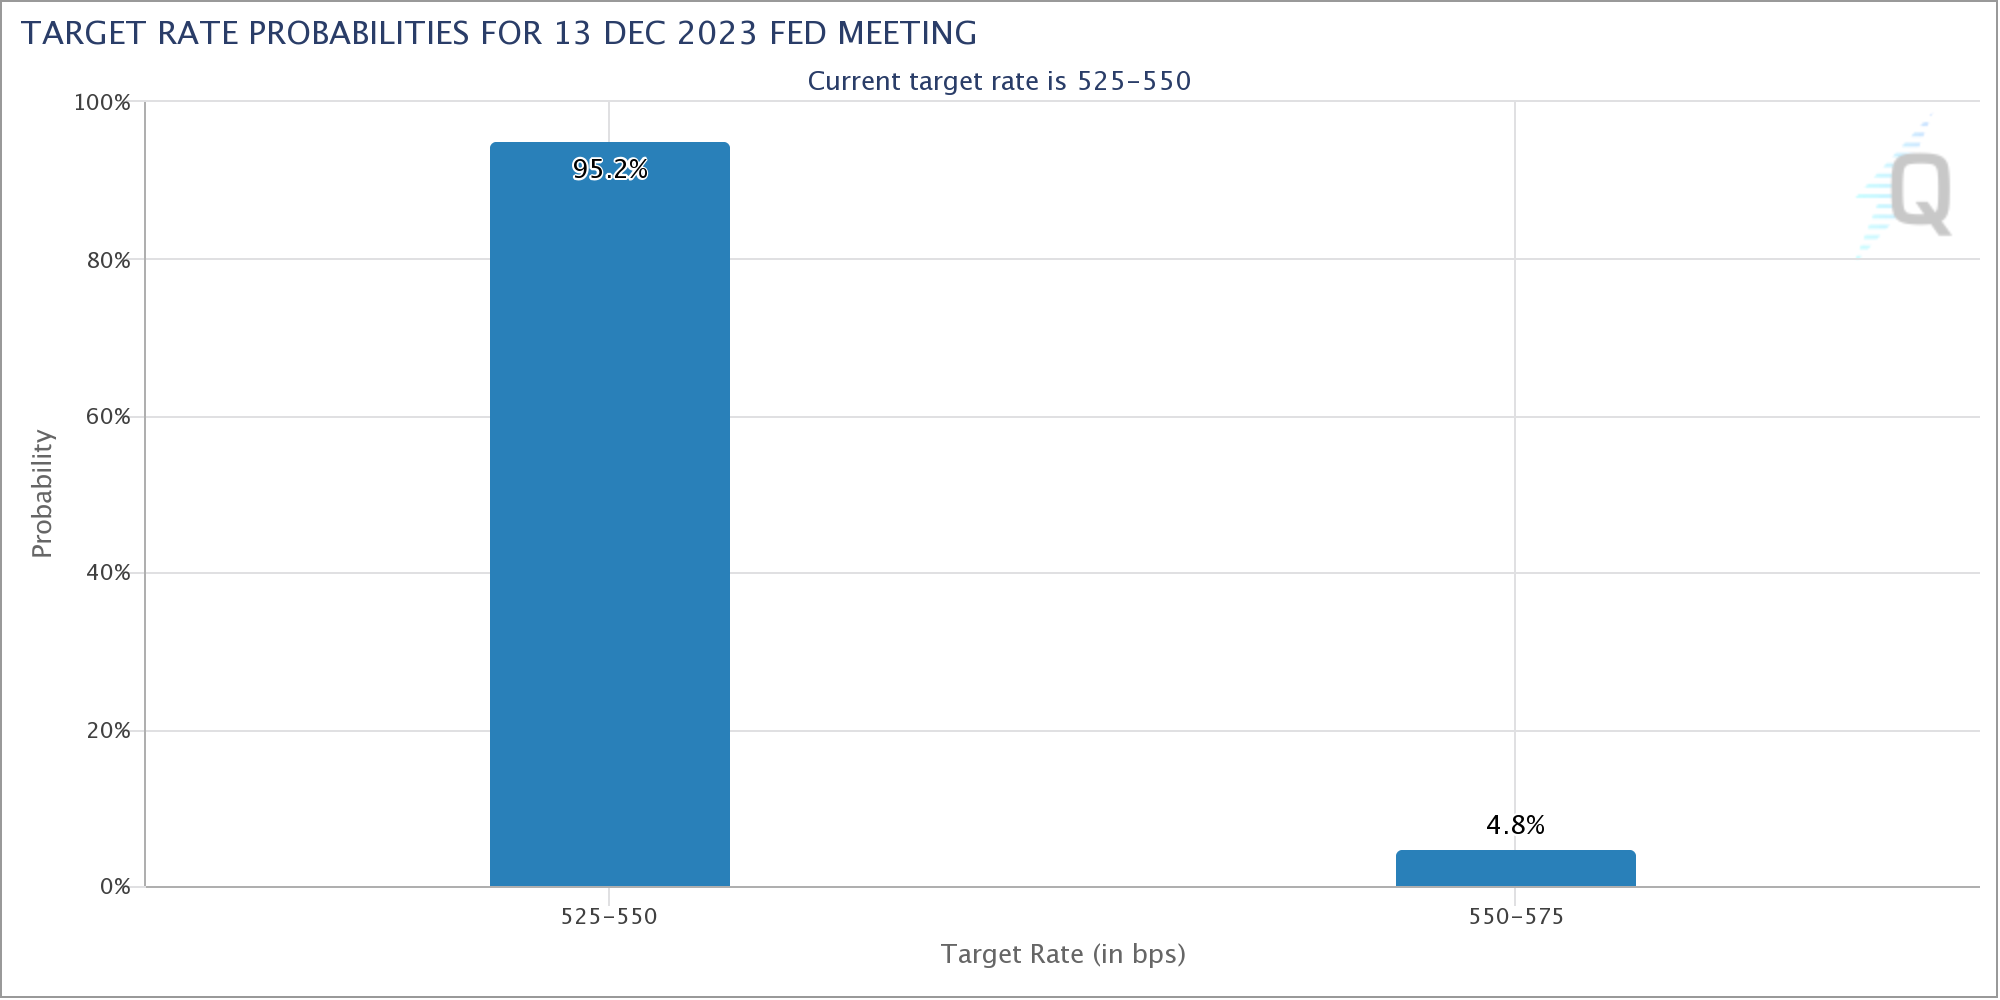
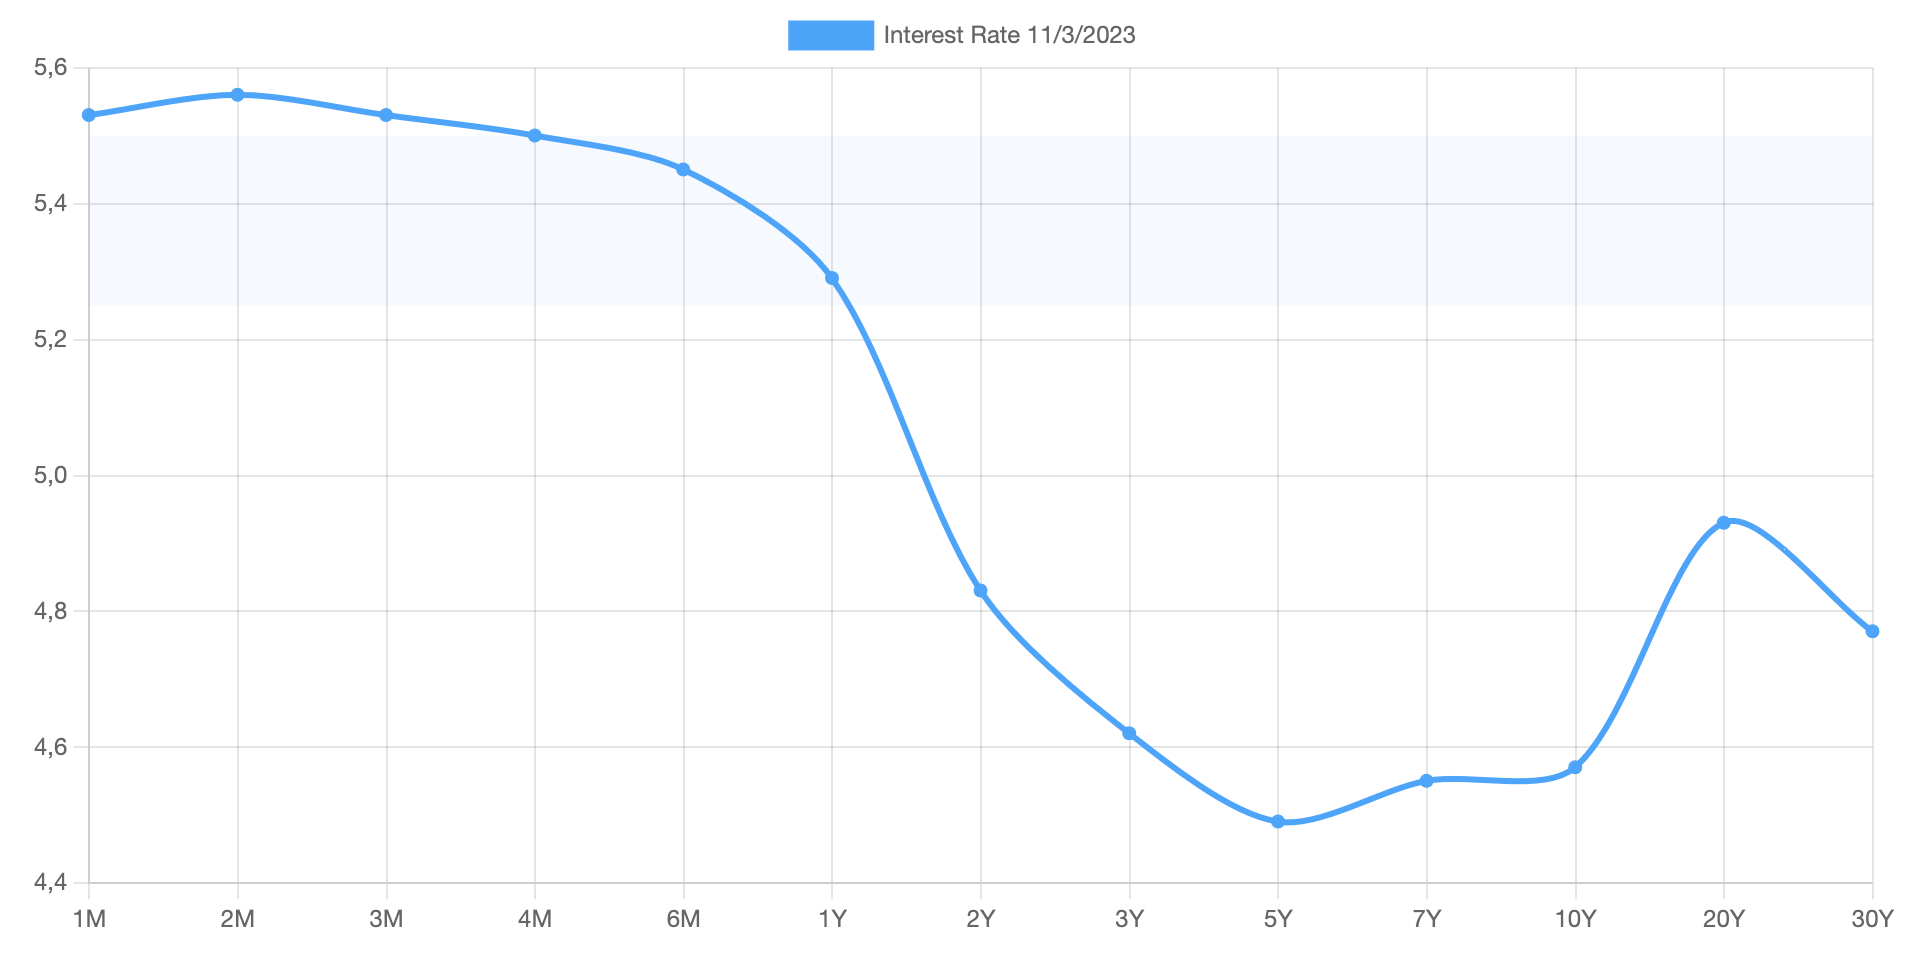
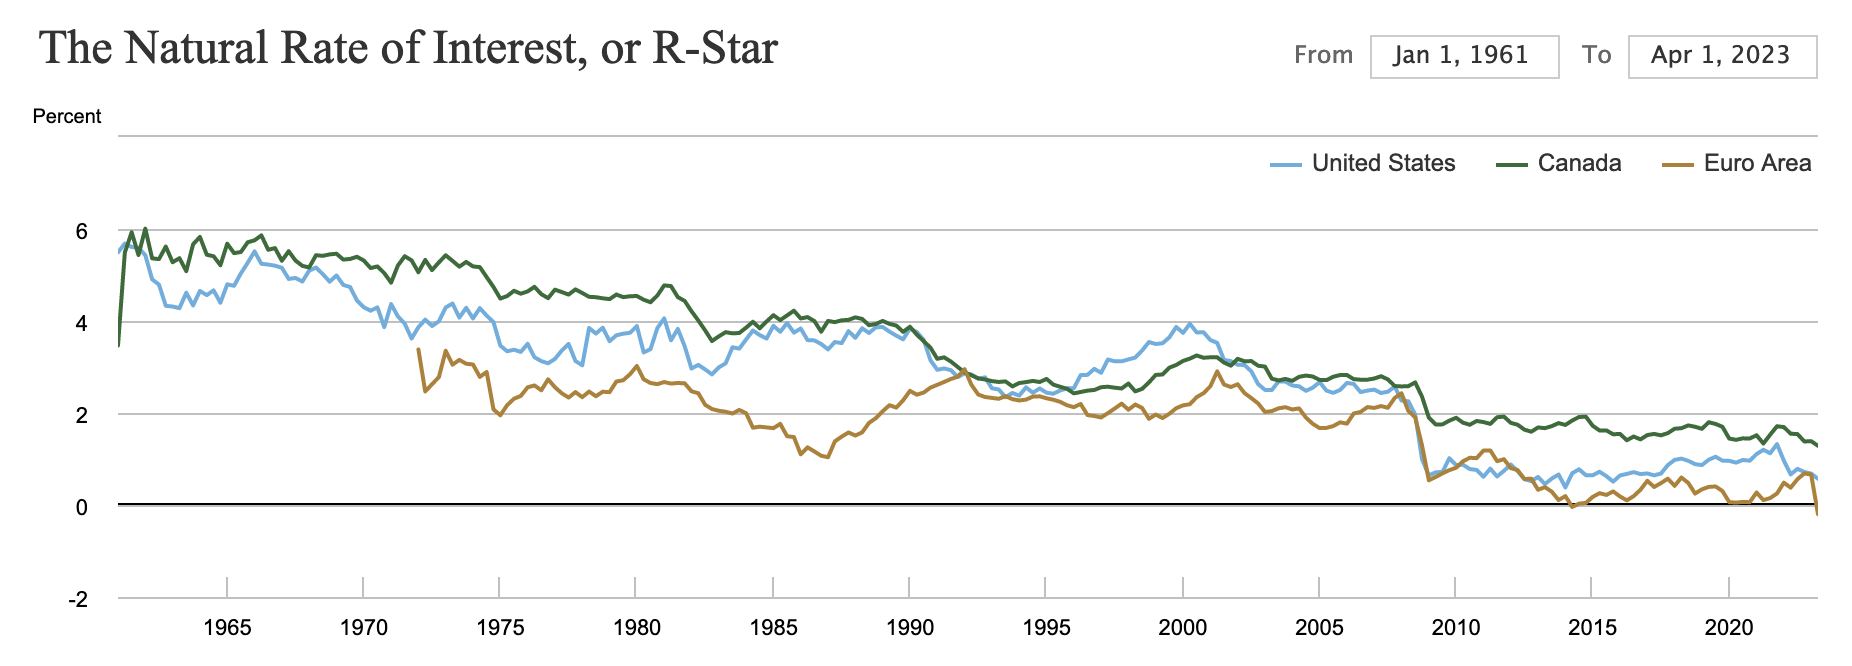
The (M2) money supply was greatly increased during the pandemic which cause massive inflation (together with various disruptions caused by the pandemic and the war) but the velocity decreased so perhaps it did not help as much as the government hoped. Velocity is picking up now though which I guess is a good sign. Unemployment rates have stayed low after increase during the pandemic as seen from the non-farm payroll data. The inflation is also coming down and the Fed did not raise rates as the Oct/Nov meeting and left it at 5.25 – 5.5 percent. The market believes that Fed won’t raise rates in Dec either. The yield curve has a funny inversed shape. Perhaps it will straighten out and de-invert now that Fed has stopped hiking rates? Many beleive that higher rates are here to stay but the natural rate of interest remain low in both the US and even more so in the EU!
Speculators were massive short SP500 in June but havbe gradually been taking off their short positions and are now neutral. They are also relatively long volatility/VIX.
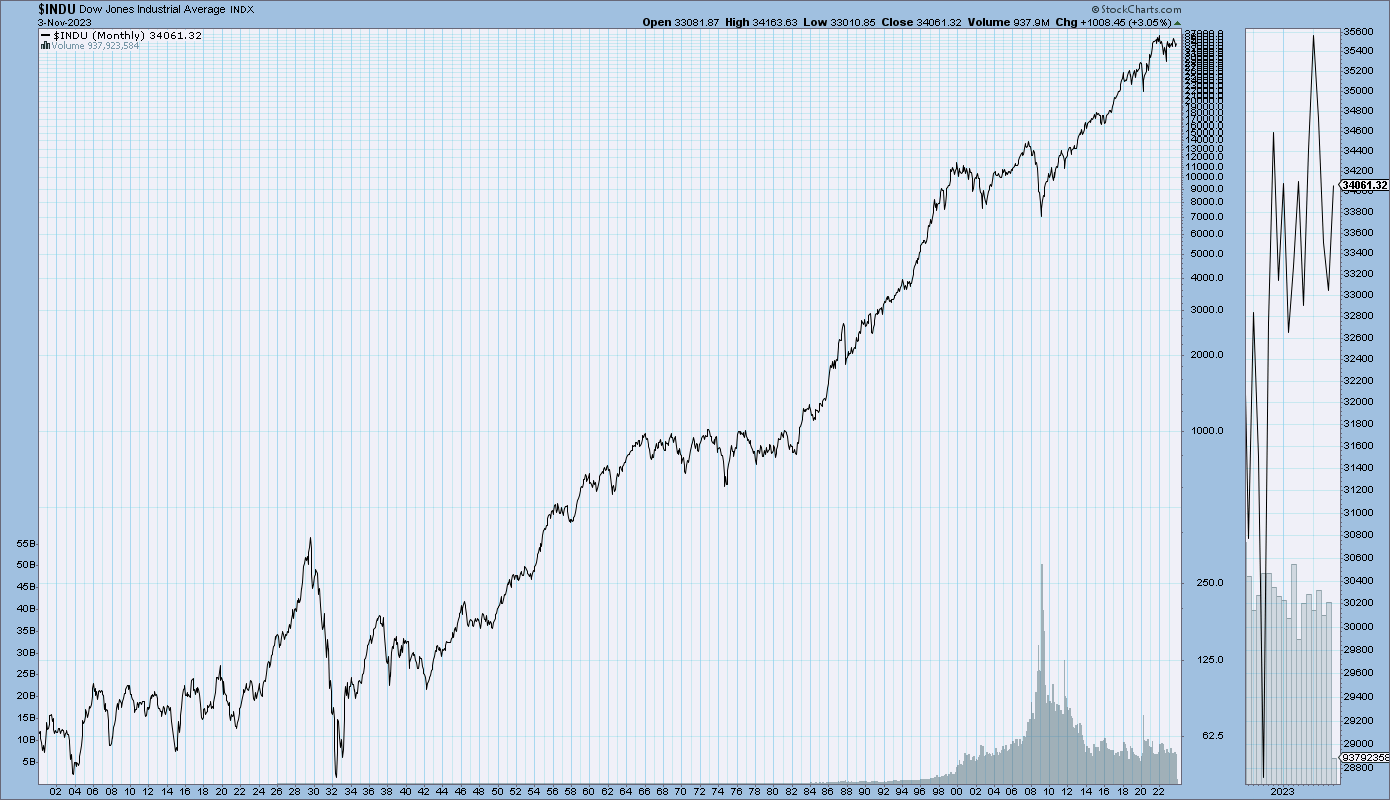
DJIA [1]
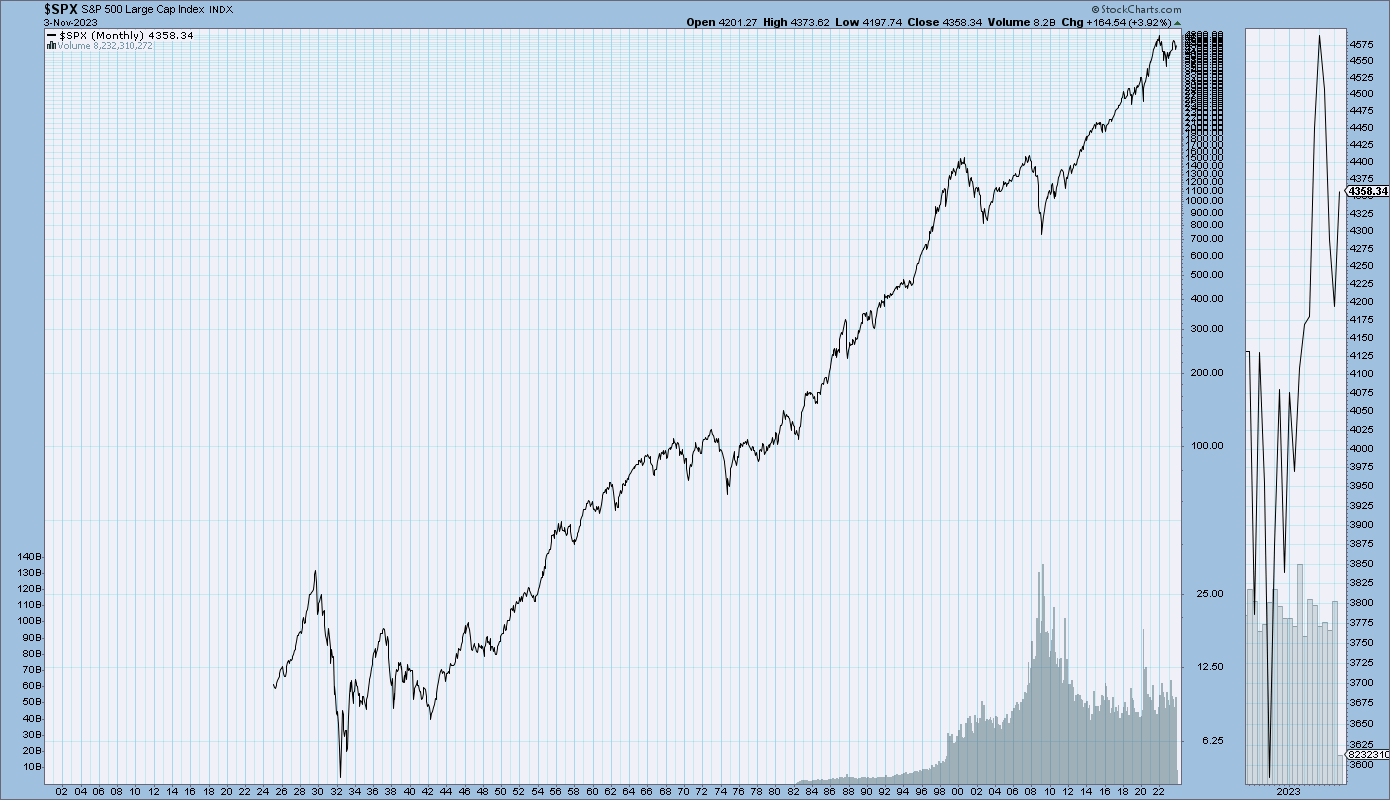
SP500 [1]
NASDAQ [1]

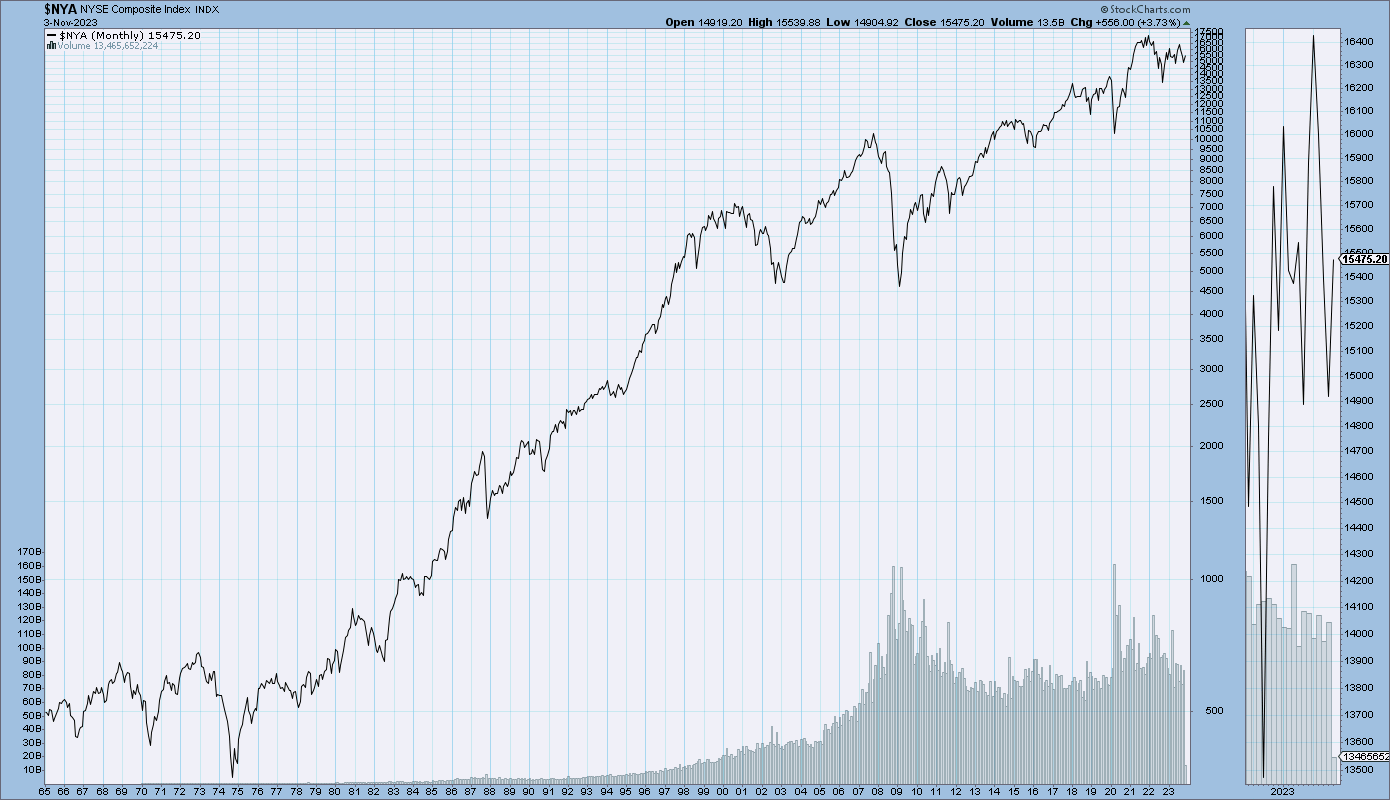
NYSE [1]
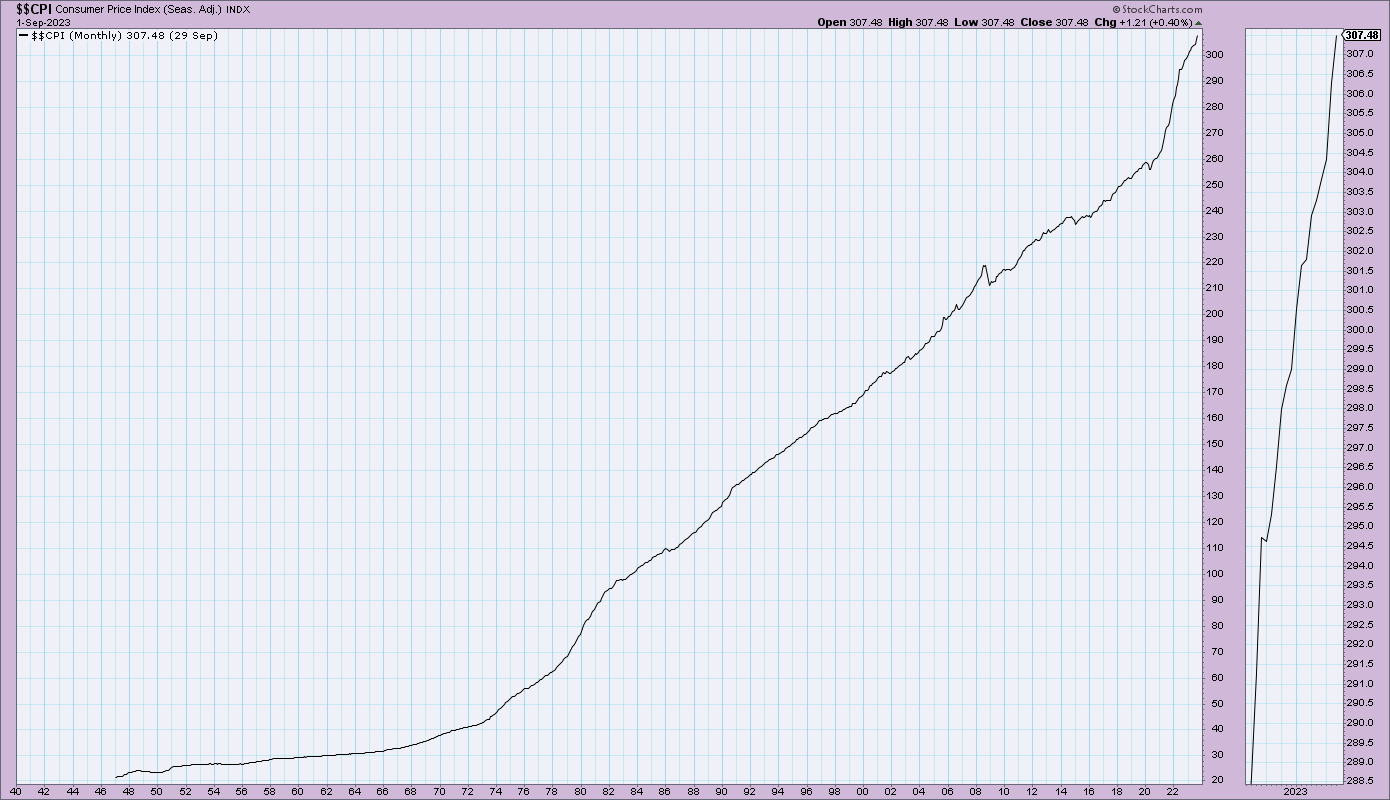
CPI [1]
Gold [1]

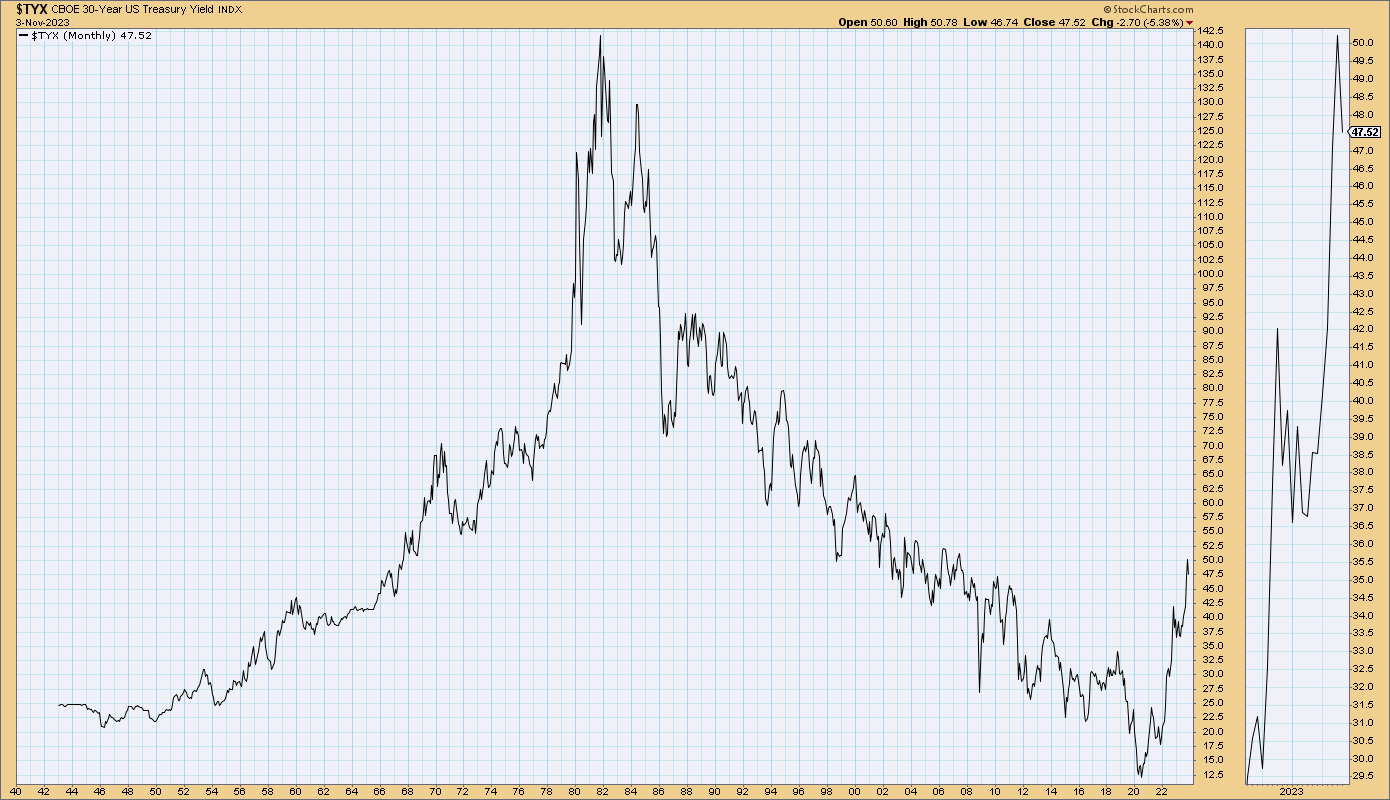
30 Year [1]
T-bill [1]
Shiller PE [2]

M2 [3]

M2 velocity [3]
Non-farm payroll [3]

Implied Target Rate [4]
COT data for SP500 [5]

COT data for NASDAQ [5]
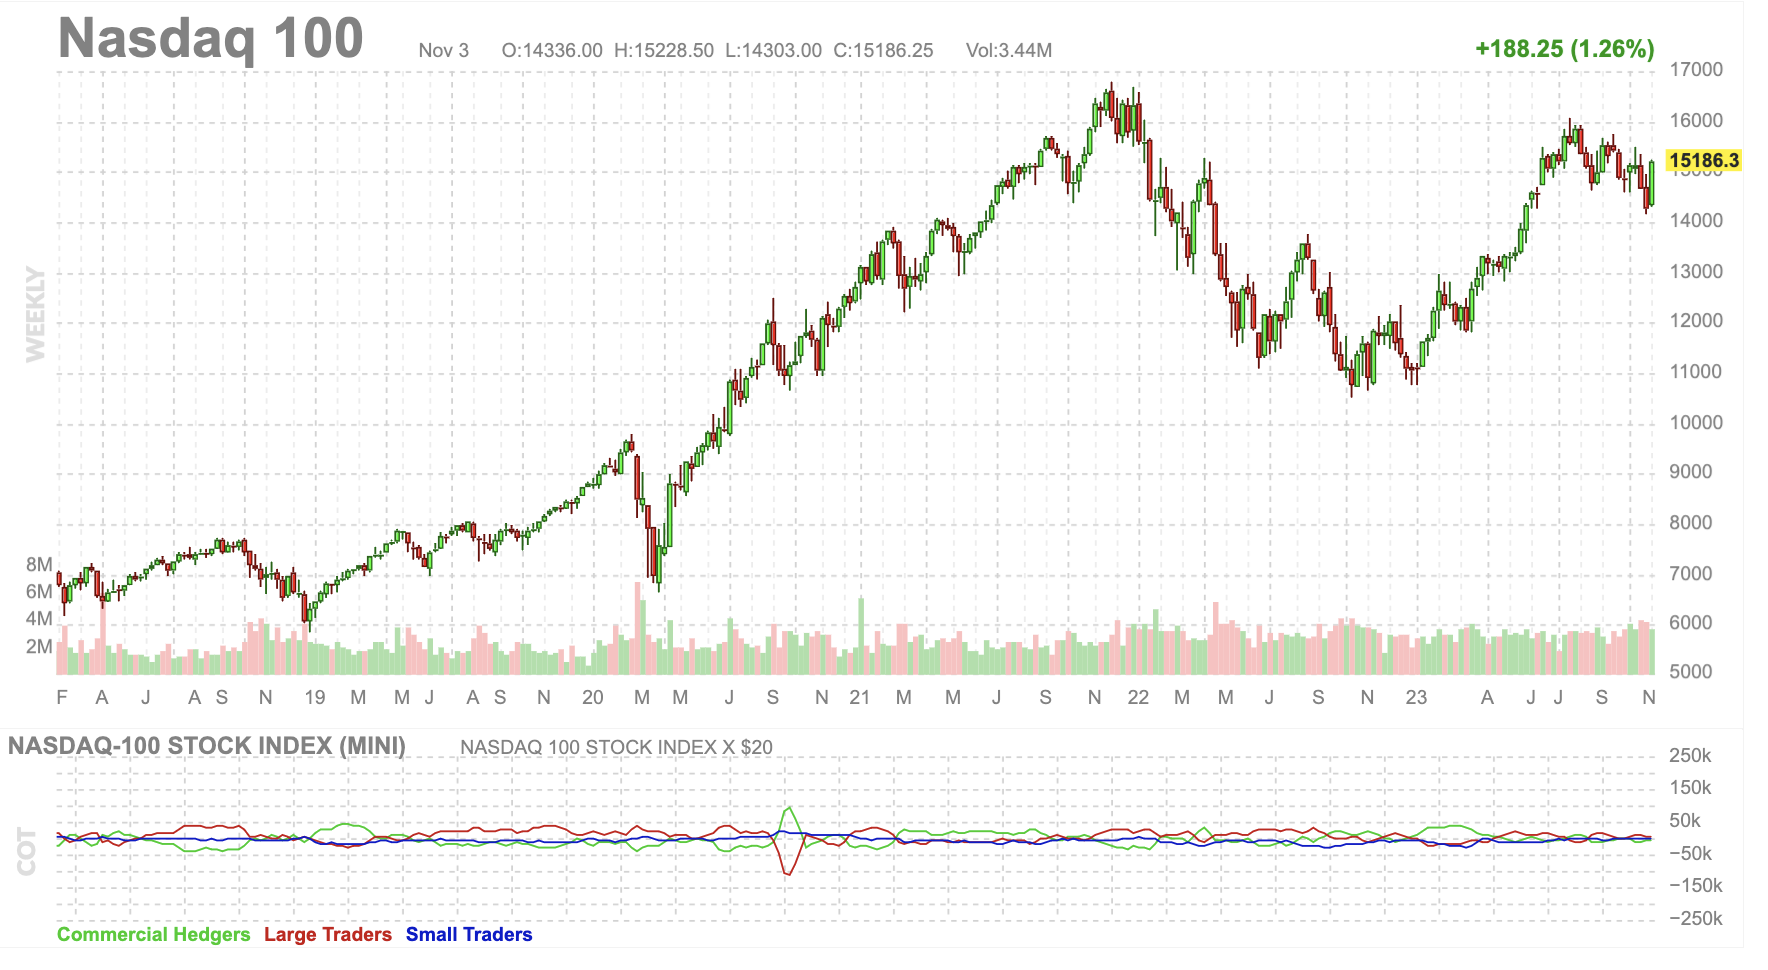
COT data for VIX [5]

SP500 Advance-Decline Index [6]
Yield Curve [^@ref7]
Natural Rate Of Interest [7]
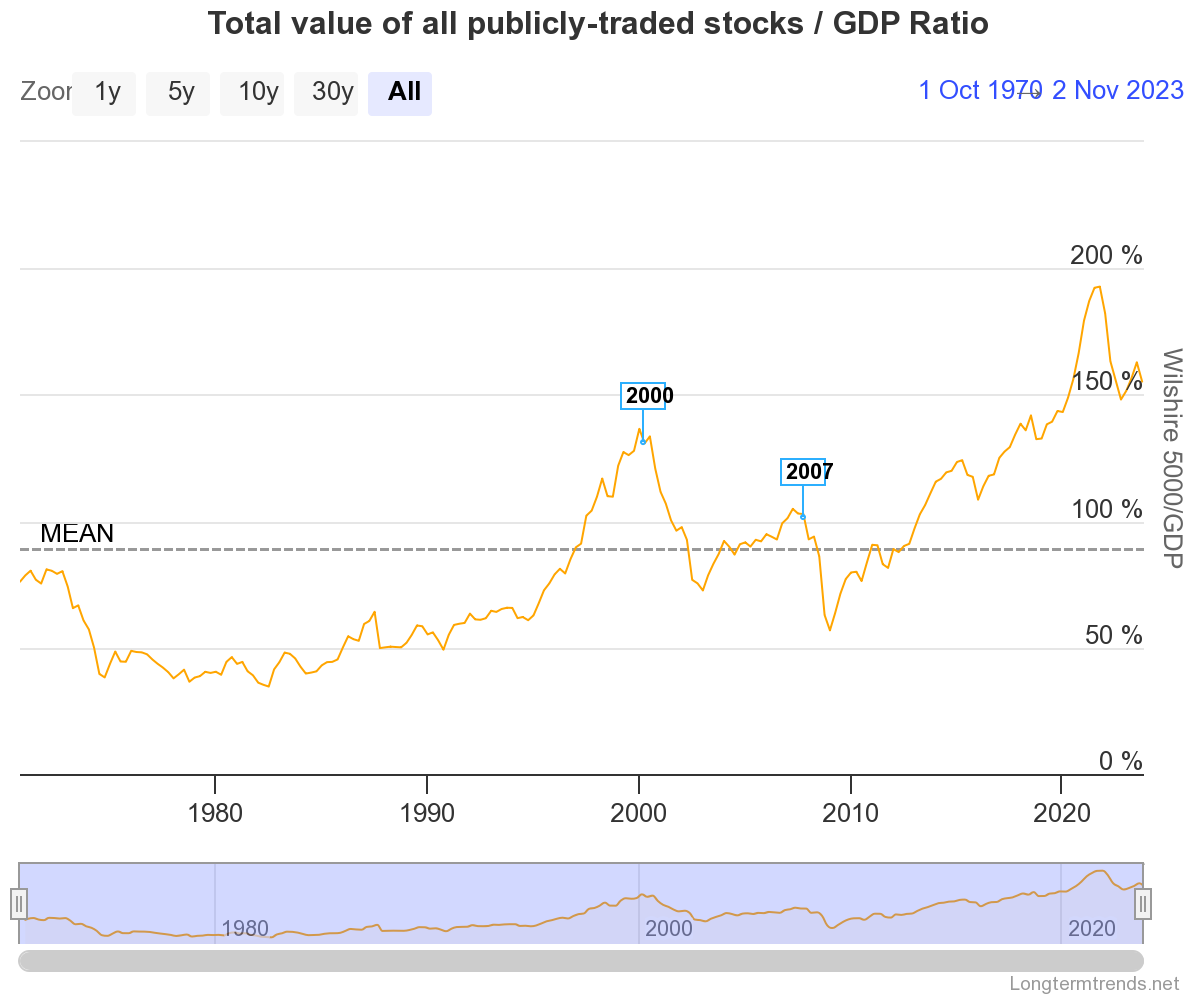
Buffet indicator (Stock market cap/GDP) [8]
SP500 compared to bonds [8]
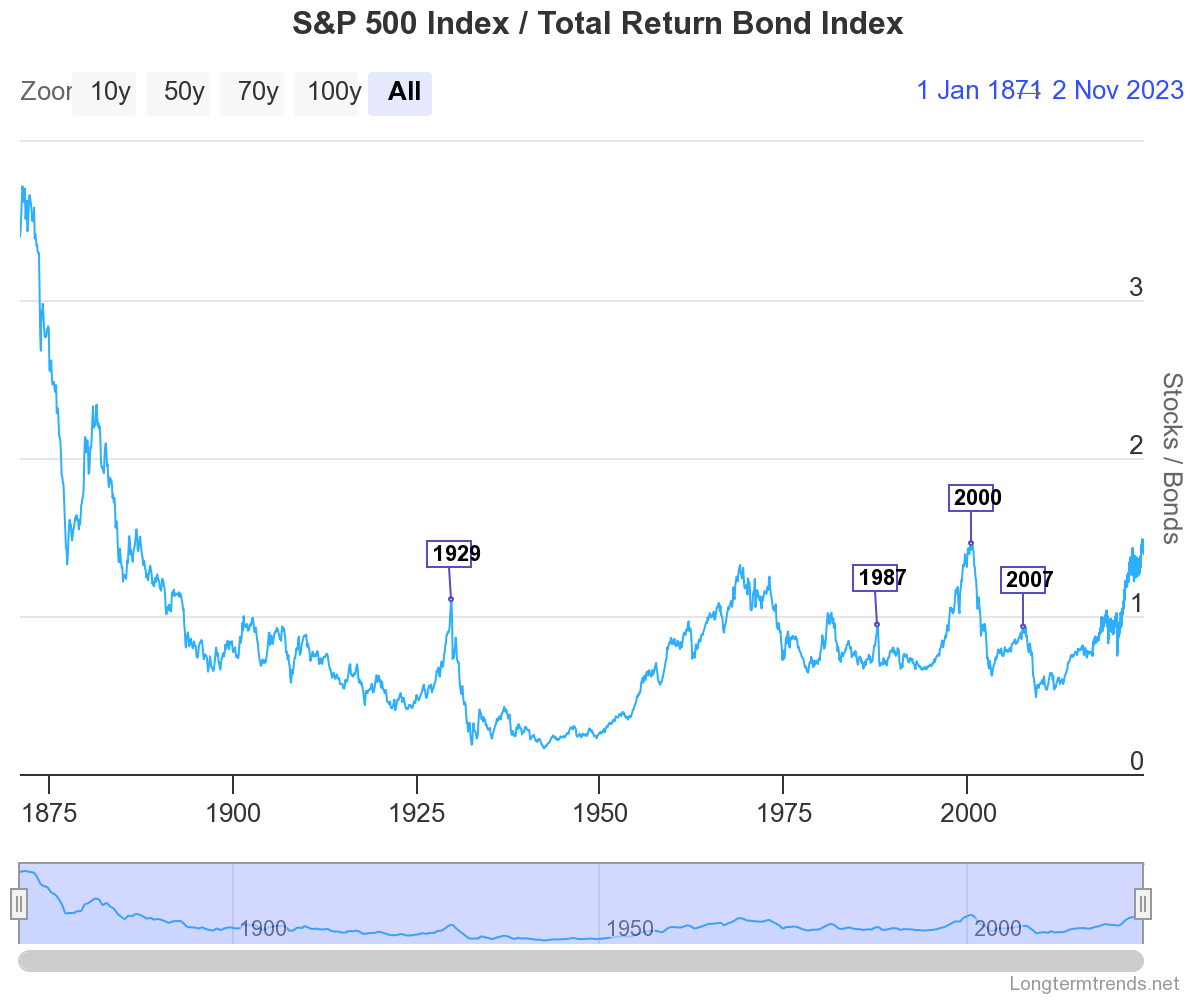
rising=stocks beats bonds, falling=bonds beats stocks